

TrustRadius Insights
Easy Dashboard Design: Several users have found designing a dashboard in iDashboards to be easy and intuitive. They mentioned that it was …
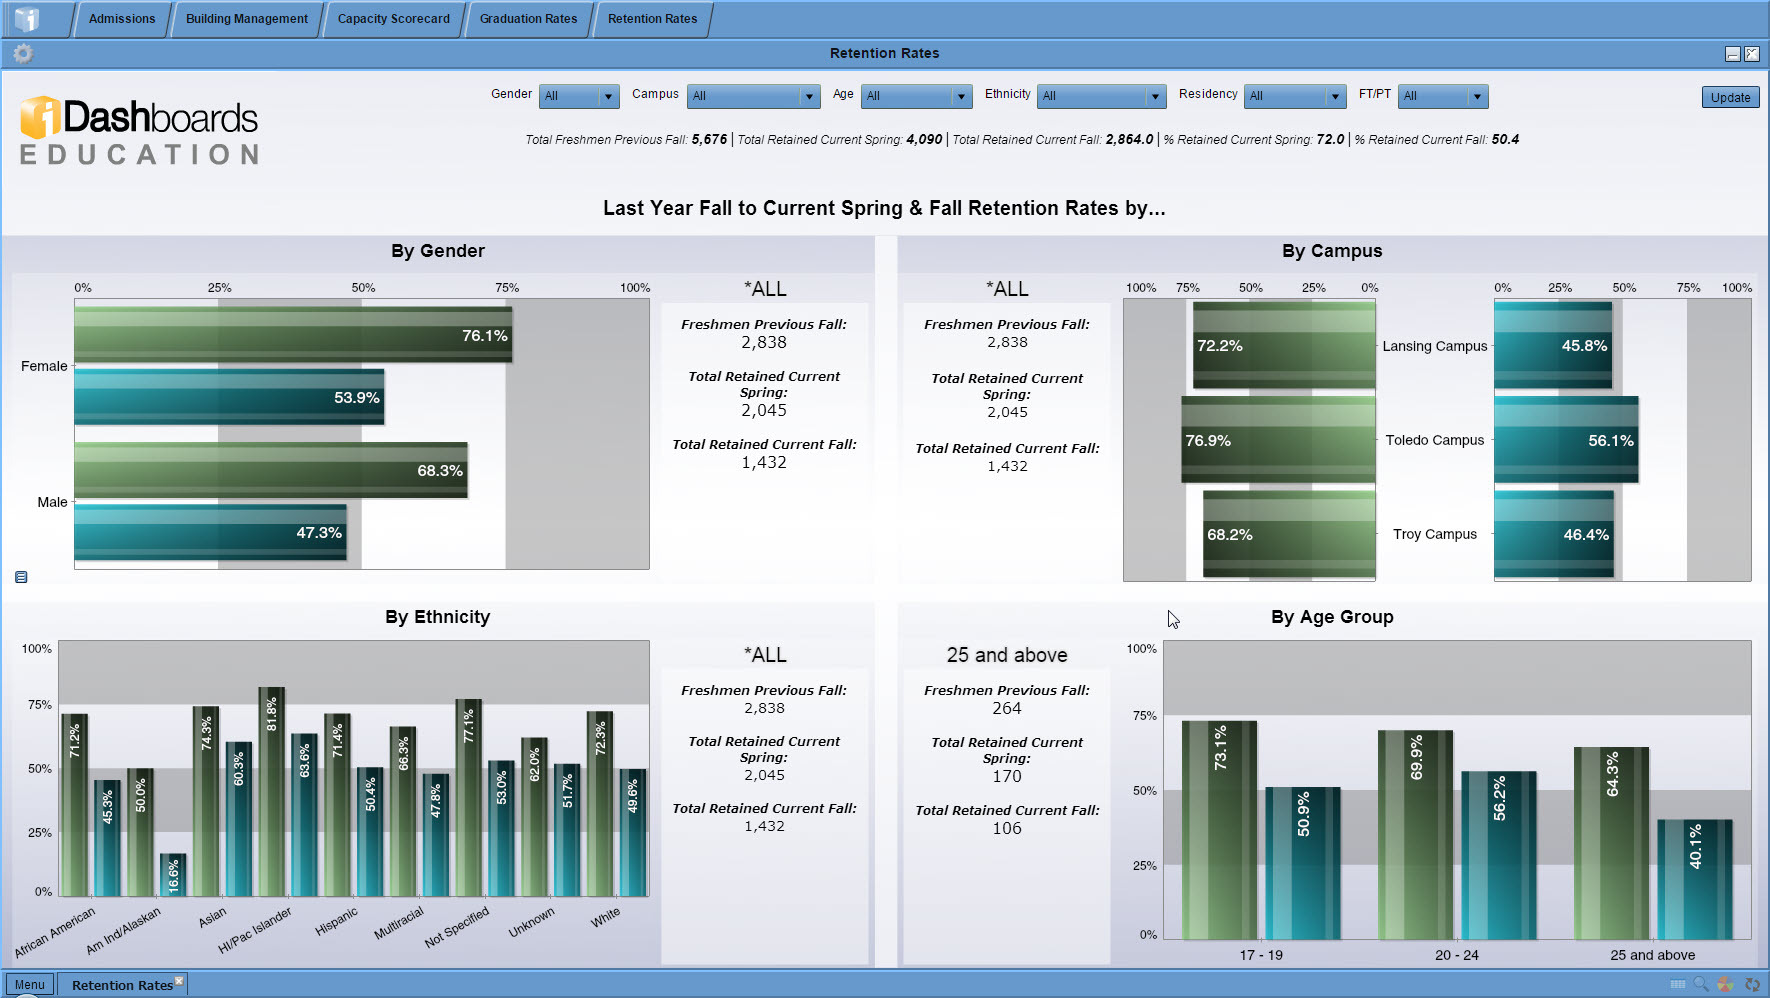
This web-based dashboard software displays data in real-time from databases, data warehouses, spreadsheets, XML and other data sources in a single location. iDashboards' built-in security framework provides role-based user permissions and access control. iDashboards Enterprise Suite is complete with software…

| Deployment Types | On-premise |
|---|---|
| Operating Systems | Windows, Linux, UNIX |
| Mobile Application | No |
Easy Dashboard Design: Several users have found designing a dashboard in iDashboards to be easy and intuitive. They mentioned that it was fairly easy to make data look visually appealing, with the ability to create robust charts and customize them as needed.
Thorough Training and Examples: Many reviewers appreciated the availability of thorough training and examples provided by iDashboards. They mentioned that the tutorials and manuals offered comprehensive guidance, making it easier for them to understand and utilize the software effectively.
Efficient Time-Saving Software: Several users highlighted the efficiency and time-saving aspect of iDashboards. They mentioned that features like data on demand and real-time analytics allowed them to access information quickly, saving valuable time in their analysis process.
Customization Options: Limited ability to customize legends, axes, and data labels. Some users have expressed disappointment with the customization options in iDashboards compared to Excel, stating that they are unable to change font size of legends, swap axes, or manipulate data labels independently.
Printing Functionality: Difficulties with printing dashboards. Several reviewers have mentioned frustration with the printing functionality in iDashboards, noting that it is not easy to print a dashboard directly. Instead, users have resorted to taking screenshots and manually cropping/pasting them into other applications for desired results.
Lack of Documentation: Insufficient documentation for data analytics features. Users have reported a lack of specific documentation related to the data analytics features in iDashboards. They often need assistance from the support team to obtain information on certain functions and formulas that are not included in the manuals.


